
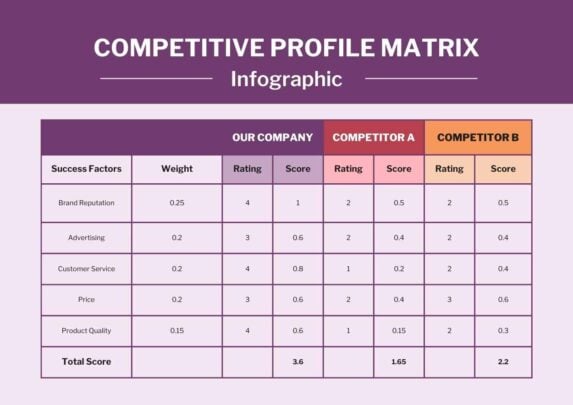
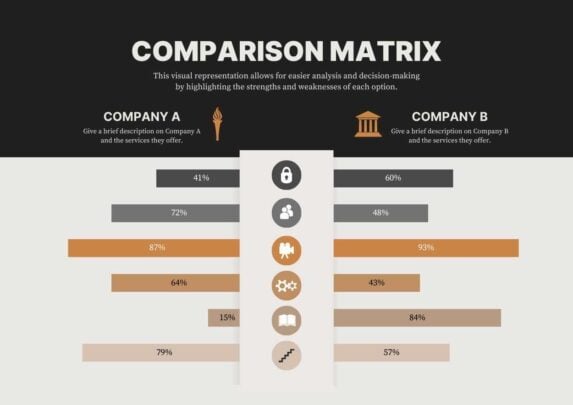

Charts Powerpoint Templates and Google Slides Themes
Transform your data into compelling narratives with our fully customizable chart presentation templates, designed to make your insights shine effortlessly.
Explore Free Charts Presentation Templates
285 templates


Supercharge your slides with Canva.
Add dynamic GIF's, captivating videos, and stylish photo frames directly from Canva's royalty-free asset library effortlessly. Share or export anywhere, be it PPT or Google Slides.
Start editing for free
Magic Write
Go from idea to your first draft *in seconds with Magic Write, our content generation tool powered by OpenAI.
Image generator
Dream it up, then add it to your design. Watch your words and phrases transform into beautiful images.

Background remover
Click to remove image backgrounds, perfect for product photos, headshots, or transparent PNGs.
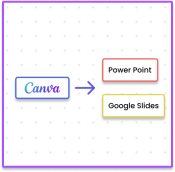
Export your results to PPT and Google Slides
Canva allows you to export to a perfect PPT or Google Slide when you are done.
Download through Canva in 3 steps
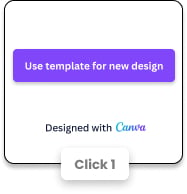
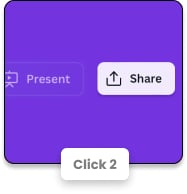
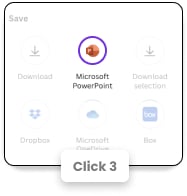
Download your Power Point in just 3 clicks!
This template was optimised for Canva with animations, photo frames, and unique fonts. However you can download it as Power Point from Canva in just 3 clicks! ✨